TFS Aggregator logging is quite rich but the exact configuration depends on your environment.
Logging levels #
The possible Logging levels are: Critical, Error, Warning, Information or Normal, Verbose, and Diagnostic.
Enable Debug Logging #
To control the verbosity in TFS Aggregator, you have to set a level attribute to the logging element in your TFSAggregator2.ServerPlugin.policies file.
Use a value like Verbose or Diagnostic.
<?xml version="1.0" encoding="utf-8"?>
<AggregatorConfiguration>
    <runtime>
        <logging level="Diagnostic"/>
    </runtime>
Note that you can use the logger object in your rules to trace execution and values.
Startup logging (2.3) #
During TFS Aggregator start, before the Policies file is read, the logging level is controlled by TFSAggregator2.ServerPlugin.dll.config, for the Server Plugin, and by Web.config, for the Web Service, through the DefaultLoggingLevel key in the appSettings section, as in this example.
<configuration>
  <appSettings>
    <add key="DefaultLoggingLevel" value="Verbose"/>
  </appSettings>
</configuration>
If the file or section is absent, the default value is Normal.
Capturing log on TFS #
For TFS on premises or hosted, you can download DebugView from Microsoft’s SysInternals site.
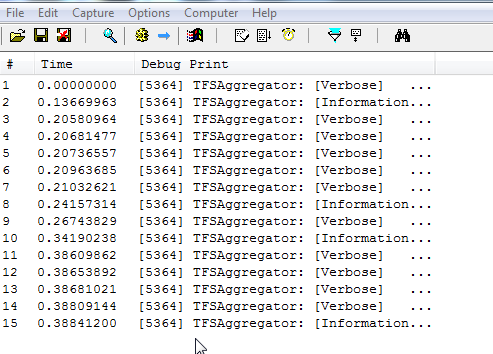
DebugView is a Trace Listener and will capture the trace messages from TFS Aggregator.
You have to run DebugView on all TFS Application Tier machines.
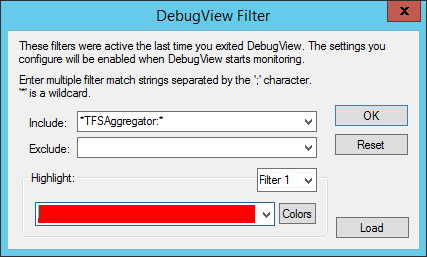
We would recommend adding the *TFSAggregator* filter to DebugView so that you only see the TFS Aggregator traces.
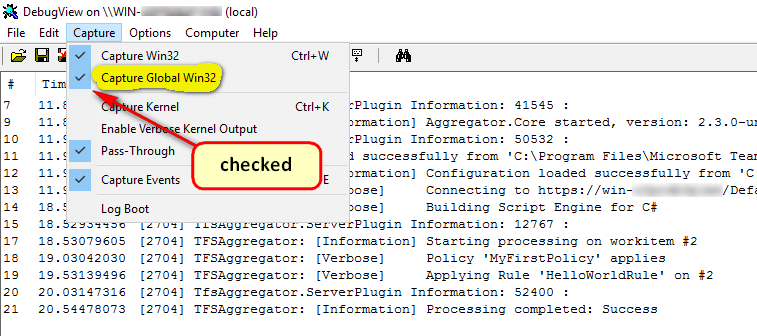
Make sure to enable the Capture Global Win32 option.
Download DebugView at http://technet.microsoft.com/en-us/sysinternals/bb896647.
TFS Production Logging (2.1) #
TFS Aggregator log messages go to:
- Debug output (appers in the Output window of a debugger)
- Application EventLog (TFS Aggregator source) when message level is
WarningorCritical - Trace listeners
User messages – i.e. logger.Log calls in Rules – use a specific Trace source: TfsAggregator.User.
Now, you can send traces to a file by adding to TFS web.config a system.diagnostics section similar to the this:
<system.diagnostics>
  <sources>
    <source name="TfsAggregator.ServerPlugin" switchValue="All">
      <listeners>
        <remove name="Default" />
        <add name="filelog" />
      </listeners>
    </source>
    <source name="TfsAggregator.User" switchValue="All">
      <listeners>
        <remove name="Default" />
        <add name="filelog" />
      </listeners>
    </source>
  </sources>
  <sharedListeners>
    <add name="filelog"
         type="Microsoft.VisualBasic.Logging.FileLogTraceListener,
                   Microsoft.VisualBasic, Version=10.0.0.0,
                   Culture=neutral, PublicKeyToken=b03f5f7f11d50a3a"
         BaseFileName="TfsAggregator.log"
         DiskSpaceExhaustedBehavior="ThrowException"
         Location="Custom"
         CustomLocation = "C:\Temp"
         MaxFileSize="81920000"
         LogFileCreationSchedule="Daily"/>
  </sharedListeners>
  <trace autoflush="true"/>
</system.diagnostics>
TFS web.config is usually located in C:\Program Files\Microsoft Team Foundation Server 15.0\Application Tier\Web Services\web.config or similar.